---
title: "Untitled"
author: "Andrew Zieffler"
date: "1/12/2020"
output: pdf_document
header-includes:
   - \usepackage{caption}
   - \captionsetup[table]{textfont={it}, labelfont={bf}, singlelinecheck=false, labelsep=newline}
---./assets/body-header.qmd
This is the third part of a short blog series I am writing to re-create some of the sample tables found in the 7th edition APA Publication Manual. In this post I will attempt to mimic Table 7.10 (p. 215). To do so, I will incorporate many ideas that I covered in the first and second of these posts.
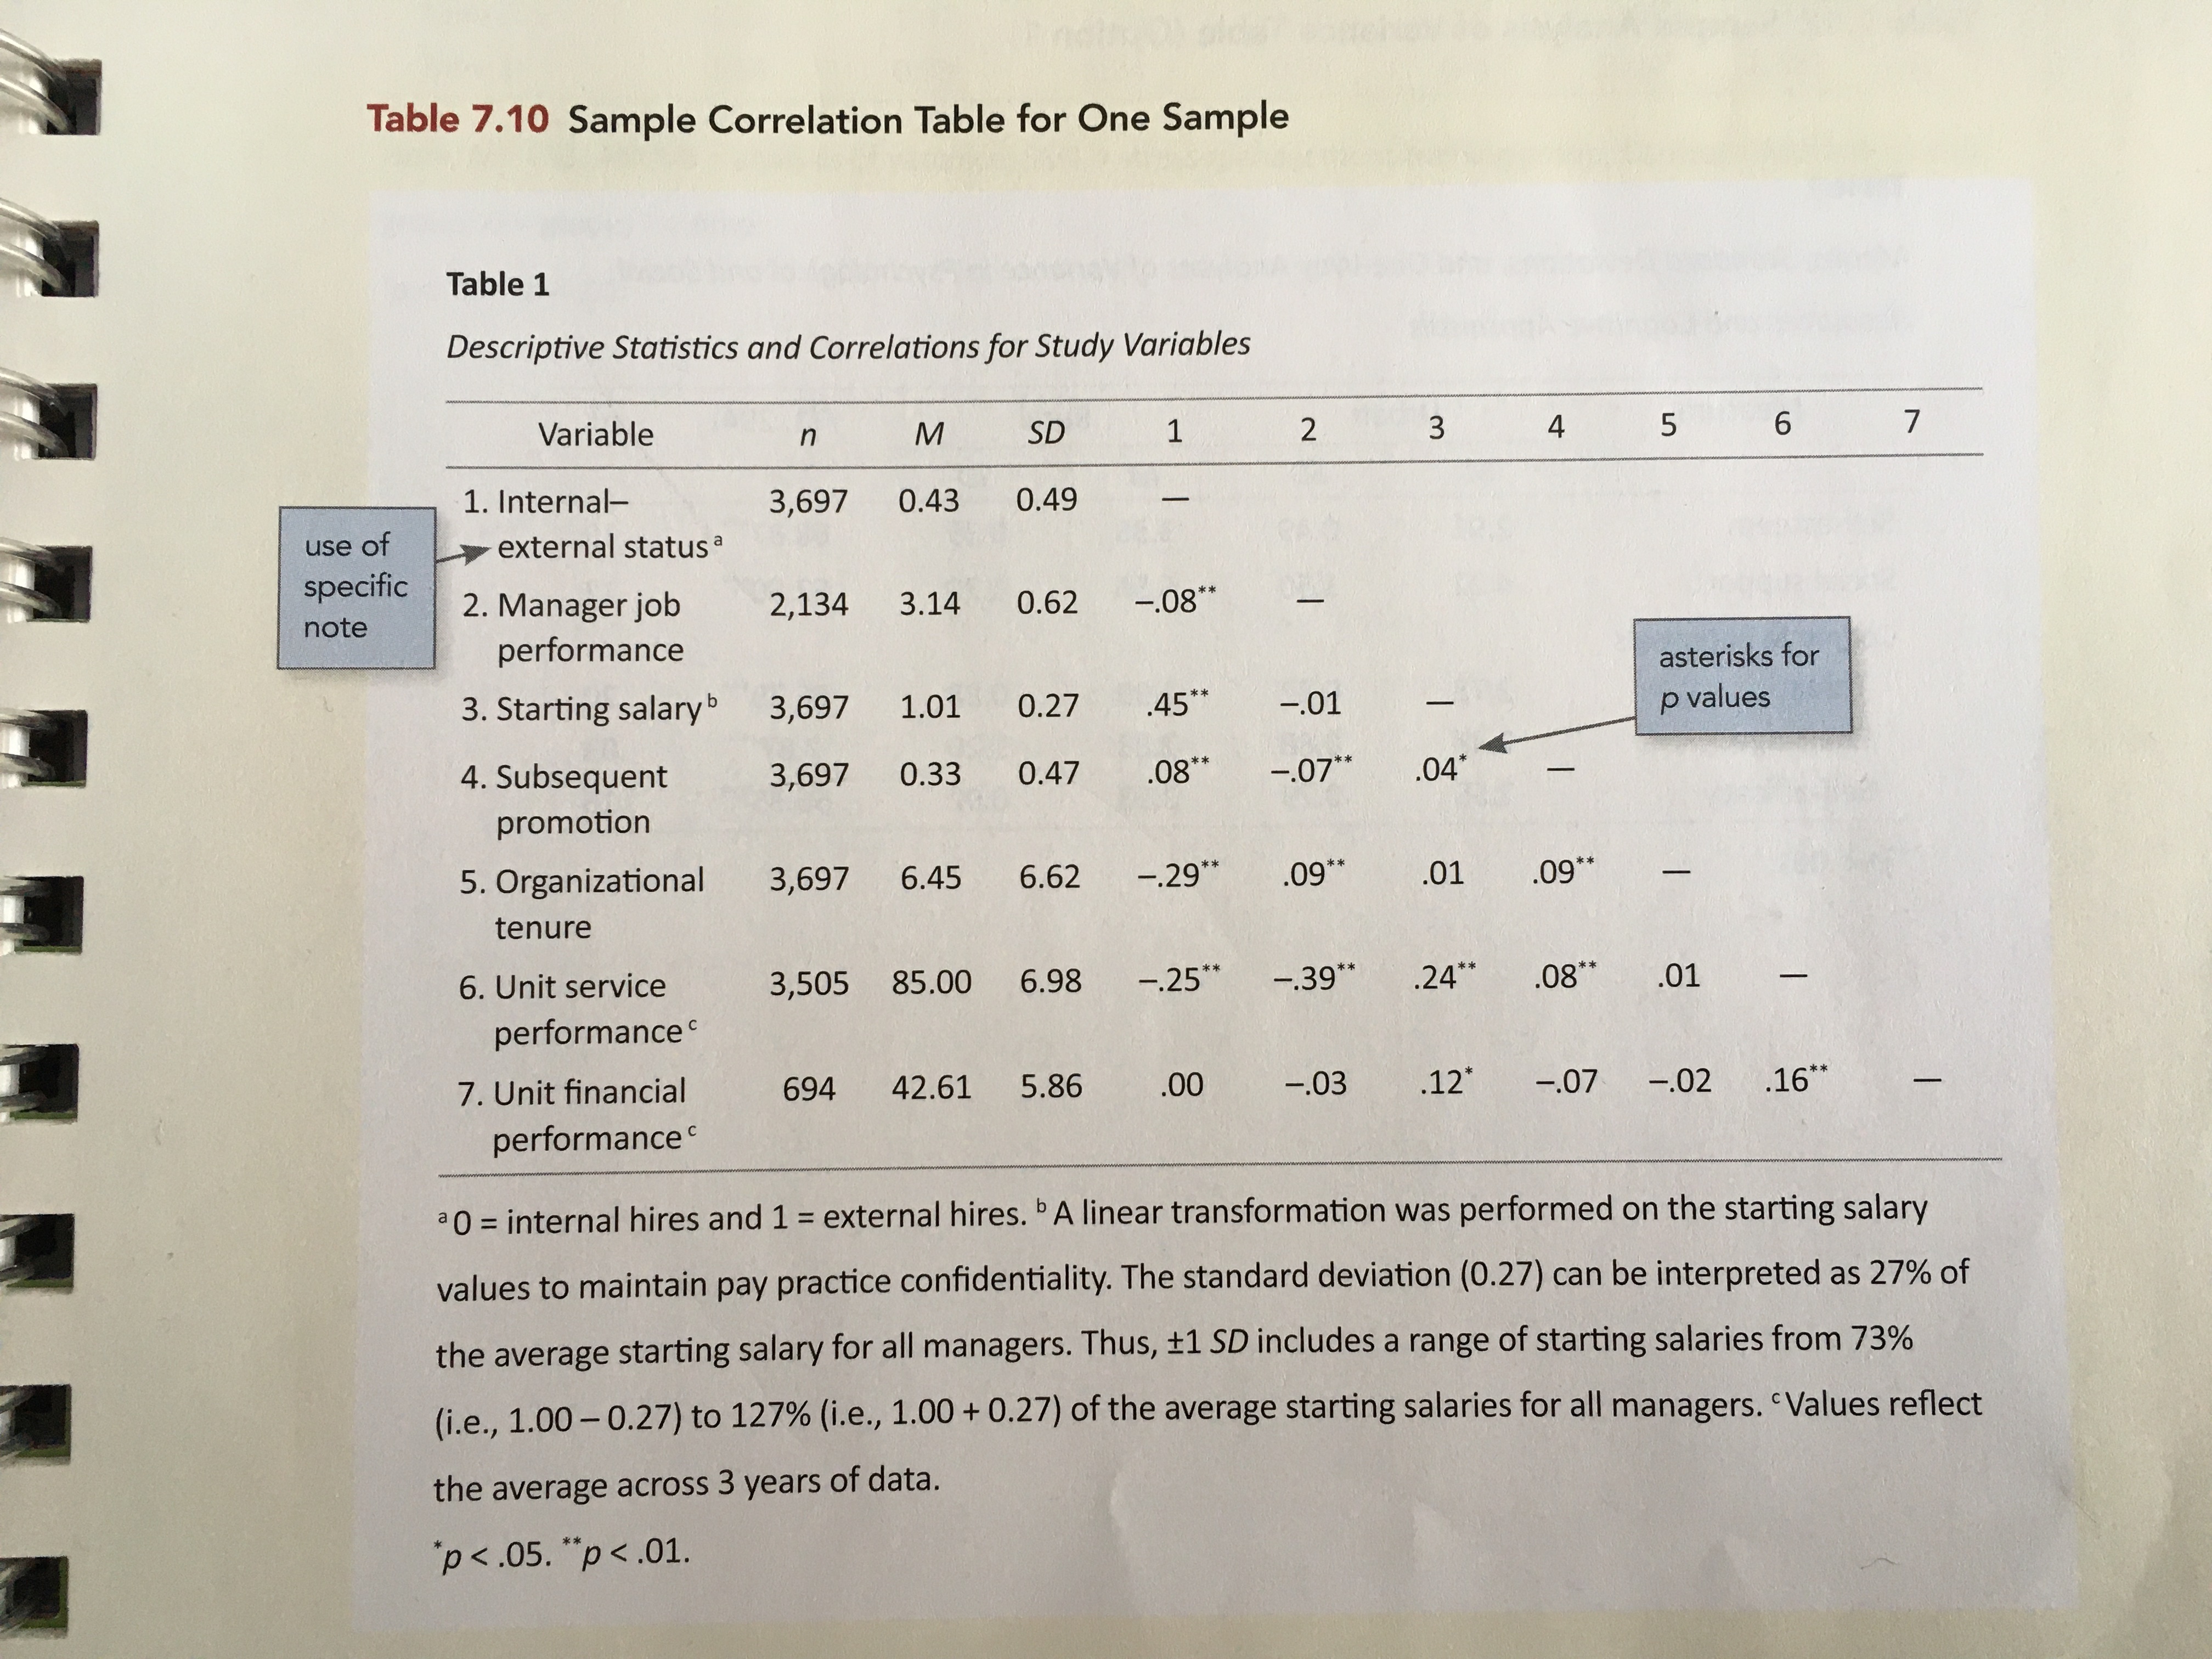
Rather than re-create this table using the data from Table 7.10, I will illustrate mimicing this table with summary information gleaned from a different dataset.
My Process
I will again render to PDF and set up the YAML to import the caption package (LaTeX) and set up the APA caption formatting.
In the RMarkdown body, I will load a few packages and also import a data set that I will use to create the summary values akin to those in Table 7.10.
# Load libraries
library(corrr)
library(knitr)
library(kableExtra)
library(tidyverse)

# Import data
mn = read_csv("https://raw.githubusercontent.com/zief0002/rustic-penguin/main/data/mn-schools.csv") |>
  mutate(public = if_else(sector == "Public", 1, 0))

# View data
head(mn)
# A tibble: 6 × 6
name grad sector sat tuition public
<chr> <dbl> <chr> <dbl> <dbl> <dbl>
1 Augsburg College 65.2 Private 1030 39.3 0
2 Bethany Lutheran College 52.6 Private 1065 30.5 0
3 Bethel University, Saint Paul, MN 73.3 Private 1145 39.4 0
4 Carleton College 92.6 Private 1400 54.3 0
5 College of Saint Benedict 81.1 Private 1185 43.2 0
6 Concordia College at Moorhead 69.4 Private 1145 36.6 0The data in were collected from http://www.collegeresults.org and contain 2011 institutional data for n=33 Minnesota colleges and universities. The codebook is available here.
We need to compute the sample size, mean, and standard deviation for each of the four variables. I will compute these and store them in a data frame. We will also need the correlations between each set of variables. I will compute these and store them in a second data frame. Then I will combine these two into a single data frame to use with kable().
# Compute n, M, and SD
tab_01 = data.frame(
  n = c(
    sum(!is.na(mn$grad)),
    sum(!is.na(mn$public)),
    sum(!is.na(mn$sat)),
    sum(!is.na(mn$tuition))
    ),
  M = c(
    mean(mn$grad, na.rm = TRUE),
    mean(mn$public, na.rm = TRUE),
    mean(mn$sat, na.rm = TRUE),
    mean(mn$tuition, na.rm = TRUE)
    ),
  SD = c(
    sd(mn$grad, na.rm = TRUE),
    sd(mn$public, na.rm = TRUE),
    sd(mn$sat, na.rm = TRUE),
    sd(mn$tuition, na.rm = TRUE)
    )
)

# Compute correlations
tab_02 = mn %>%
  select(grad, public, sat, tuition) %>%
  correlate() %>%
  shave(upper = TRUE) %>%
  fashion(decimals = 2, na_print = "—")

# Combine information into single table
tab_03 = cbind(tab_02[1], tab_01, tab_02[-1])

# View table
tab_03
term n M SD grad public sat tuition
1 grad 33 60.9515152 16.7375723 — — — —
2 public 33 0.3030303 0.4666937 -.40 — — —
3 sat 33 1101.2121212 111.4256360 .89 -.19 — —
4 tuition 33 32.2531818 11.3083707 .75 -.77 .61 —The next thing I will do is to change the text in the rowname column to correspond to similar rownames in Table 7.10. Note the use of $^a$ and $^b$ to produce superscripts of “a” and “b” respectively. I will inlcude these in the footnote to define these variables.
tab_03$rowname = c(
  "1. Graduation rate",
  "2. Sector$^a$",
  "3. Median SAT score",
  "4. Tuition$^b$"
  )
I will then pipe this into the kable() function to set the column names, column alignment, and table caption. The digits= argument is included to round the values in each column. (Since the first column is text we set this to NA.)
I also employ similar kableExtra function from those introduced in Part 1 and and Part 2 to make the table the full page width, include the footnote, center the header names, and increase the width of the first column.
kable(
  tab_03,
  format = "latex",
  booktabs = TRUE,
  escape = FALSE,
  longtable = TRUE,
  col.names = c("Variable", "$n$", "$M$", "$SD$", "1", "2", "3", "4"),
  align = c("l", "c", "c", "c", "c", "c", "c", "c"),
  digits = c(NA, 0, 2, 2, 2, 2, 2, 2),
  caption = "Descriptive Statistics and Correlations for Study Variables"
  ) %>%
  kable_styling(full_width = TRUE) %>%
  footnote(
    general_title = "Note.",
    general = "$^a$0 = private schools and 1 = public schools. $^b$Tuition is measured in thousands of dollars.",
    threeparttable = TRUE,
    footnote_as_chunk = TRUE,
    escape = FALSE
    ) %>%
  row_spec(row = 0, align = "c") %>%
  column_spec(column = 1, width = "1.5in")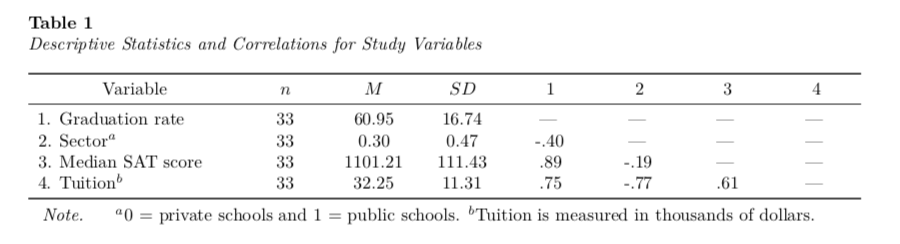
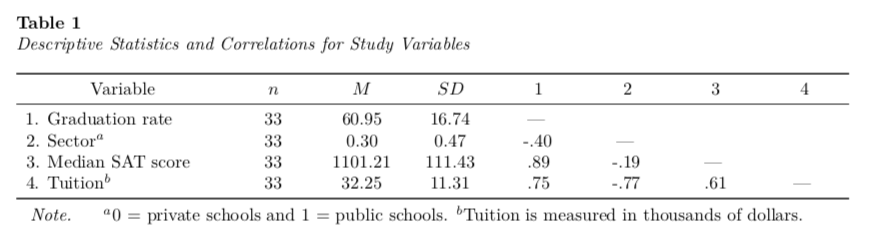
To alleviate the off-diagonal hyphens in the correlation part of the table we need to set the “-” value to blank text. We can do this with indexing.
tab_03[1, 6:8] = ""
tab_03[2, 7:8] = ""
tab_03[3, 8] = ""
Then we can re-run the kable() syntax.
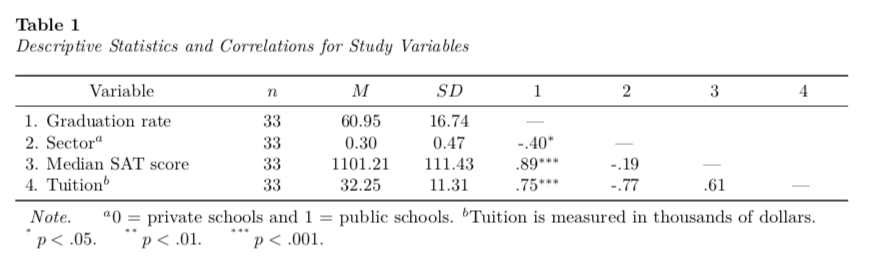
p-Values and Stars
I would not personally add the significance stars to the correlations in the table. This is inconsistent with what the American Statistical Association has outlined for good statistical practice.
But, if you insist on poor statistical decisions (he says snarkily) you can also use indexing to add the stars. The problem is that this turns numbers to text strings, so every other value in that column will also be a text string, and the digits= argument will no longer be able to round things.
Here I use indexing to turn every value in the first column of correlations into text string. (The dash in the diagonal ) Then you could add the NA into the digits= argument of kable(). You would also need to add the appropriate text into the table note.
# Change correlation values in first column
tab_03[2, 5] = "-.40$^{*}$"
tab_03[3, 5] = ".89$^{***}$"
tab_03[4, 5] = ".75$^{***}$"

#Create table
kable(
  tab_03,
  format = "latex",
  booktabs = TRUE,
  escape = FALSE,
  longtable = TRUE,
  col.names = c("Variable", "$n$", "$M$", "$SD$", "1", "2", "3", "4"),
  align = c("l", "c", "c", "c", "c", "c", "c", "c"),
  digits = c(NA, 0, 2, 2, 2, 2, 2, 2),
  caption = "Descriptive Statistics and Correlations for Study Variables"
  ) %>%
  kable_styling(full_width = TRUE) %>%
  footnote(
    general_title = "Note.",
    general = "$^a$0 = private schools and 1 = public schools. $^b$Tuition is measured in thousands of dollars.",
    symbol = c("$p<.05.$", "$p<.01.$", "$p<.001.$"),
    symbol_manual = c("$^{*}$", "$^{**}$", "$^{***}$"),
    threeparttable = TRUE,
    footnote_as_chunk = TRUE,
    escape = FALSE
    ) %>%
  row_spec(row = 0, align = "c") %>%
  column_spec(column = 1, width = "1.5in")